
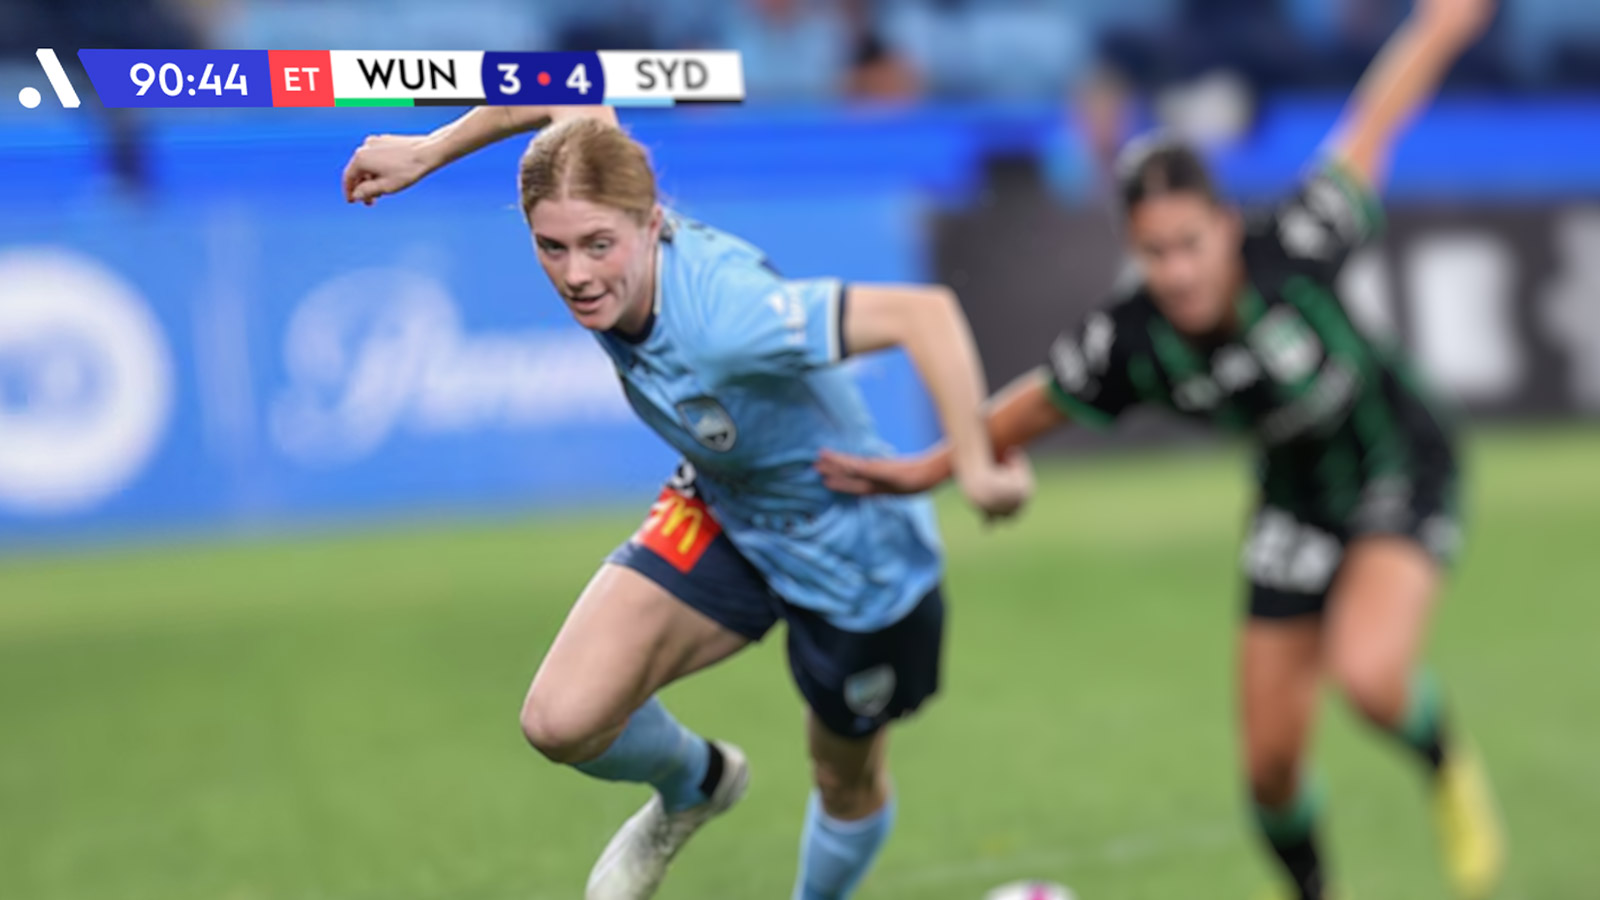
Live sports broadcasts look effortless when they work. A pass lands, the stat appears. A driver crosses the line, the leaderboard updates. A goal goes in, the score swaps. None of that is effortless. Behind every clean graphic is a data pipeline doing a lot of work very quietly. Here’s how we build those pipelines, and why reliability is the only feature that actually matters.
Live data is fragile by default
Sports data feeds come from a lot of sources. Timing systems on the track. Telemetry from the cars. Scoring APIs from official providers. Stats services. Social feeds. Sponsor schedules. Weather. Each of those sources has its own format, its own latency, its own failure mode, and its own definition of “live.”
A graphics system built for a single feed will work until the second feed arrives. A system built for happy-path data will work until something goes wrong. And in live sports, something always goes wrong — a feed drops, a clock drifts, a scoring decision is overturned, a player’s name is misspelled in the source data. The question isn’t whether problems happen. It’s whether the system handles them without anyone watching at home noticing.
What reliability actually requires
Three things make a real-time graphics pipeline reliable.
Redundancy at every layer. If one data source fails, another takes over. If one cloud region has trouble, another picks up. If one renderer goes down, another is already warm. You don’t build redundancy after the first outage. You build it before broadcast day.
Validation before render. Bad data should never reach the screen. A name field that’s too long, a score that doesn’t match the format, a timing value outside expected bounds — all of these should be caught by the platform before they become an embarrassing graphic. This is unglamorous engineering and it’s the difference between a system you can trust and one you can’t.
Latency you can measure. Real-time isn’t a marketing word. It’s a measurable property of the system. We track the time from data event to on-screen change for every output, and we design backwards from the budget the broadcast allows.
Why cloud architecture matters here
Cloud-based rendering is sometimes pitched as “the same thing, cheaper.” It isn’t. Cloud infrastructure changes what’s possible: dynamic scaling for big events, geographic redundancy across regions, instant failover, asynchronous testing against historical data. None of those are nice-to-haves in live sports. They’re how you survive a broadcast going sideways at 3:00pm on a Saturday.
The cloud also changes who can operate the system. A traditional graphics rig requires a specialist in the truck. A cloud-based system can be operated from anywhere, supervised by a small team, and supported by engineers on call. That’s not just more efficient — it’s more robust, because the people who built the system are the people watching it run.
What it looks like in practice
A typical live sports broadcast running on Lightning Visuals integrates three to seven data sources, runs across multiple cloud regions, supports several simultaneous outputs (broadcast, streaming, stadium screens, partner feeds), and is supervised by one or two operators. Pre-event testing happens against the actual live feeds, days before broadcast. On the day, the system runs itself for most of the show — operators step in only for the moments where editorial judgment is needed.
Reliability is the only feature that counts
You can have the best-designed graphics in the industry. If they break on broadcast day, no one remembers the design. The work that goes into never breaking is the work that earns the next contract. That’s where we focus.
Need a live graphics system you can actually trust on broadcast day? Talk to our engineers.